
Understanding Evaluated Pricing
This guide is a walk-through of how to understand and use Moment's Evaluated Pricing products.
Evaluated Prices APIs
The APIs below are used to retrieve information on evaluated pricing at Moment.
Get Price Chart
The Price Chart API returns aggregate data for a given bond identifier over a specified time period (up to 5 years of historical data). This should be queried on demand to provide users with a chart of prices for a given bond. To use this endpoint, a CUSIP or ISIN must be entered. Then, the frequency of price observations (options include 1 day, 15 minutes, and 1 minute) must be chosen, along with a start date and an end date in YYYY-MM-DD format.
Usage Information
If the specified bond exists in our universe, you will receive a response with all available price data for the specified time frame. For example, if there is no price data for the specified bond in the given time period, the response will contain an empty prices array.
If the specified bond does not exist in our universe or is inactive, you will receive an invalid_request error.
The start and end days define a time range for retrieval. For example, to receive data for August 5, 2023, you would set start=2023-08-05 and end=2023-08-06. This will not return data for August 6, 2023.
Return Value Information
Returned results are sorted by price timestamp in ascending order.
Note that in rare cases, there may not be a price for every window. E.g., there may be prices for 12:00, 12:15, and 12:45, but not 12:30. If you are showing prices to end users and want to show a continuous dataset, you can carry forward the prices from the previous time window. E.g., if the 12:15 price was $80 you would use $80 for the 12:30 price as well.
The timestamp we return is a timestamp for the start of an interval with the selected frequency. For example, if we return a timestamp of 2023-08-05T14:30:00Z, then we are returning the aggregate price for the interval from 2023-08-05T14:30:00Z to 2023-08-05T14:45:00Z.
Retrieve marks for a collection of ISINs/CUSIPs
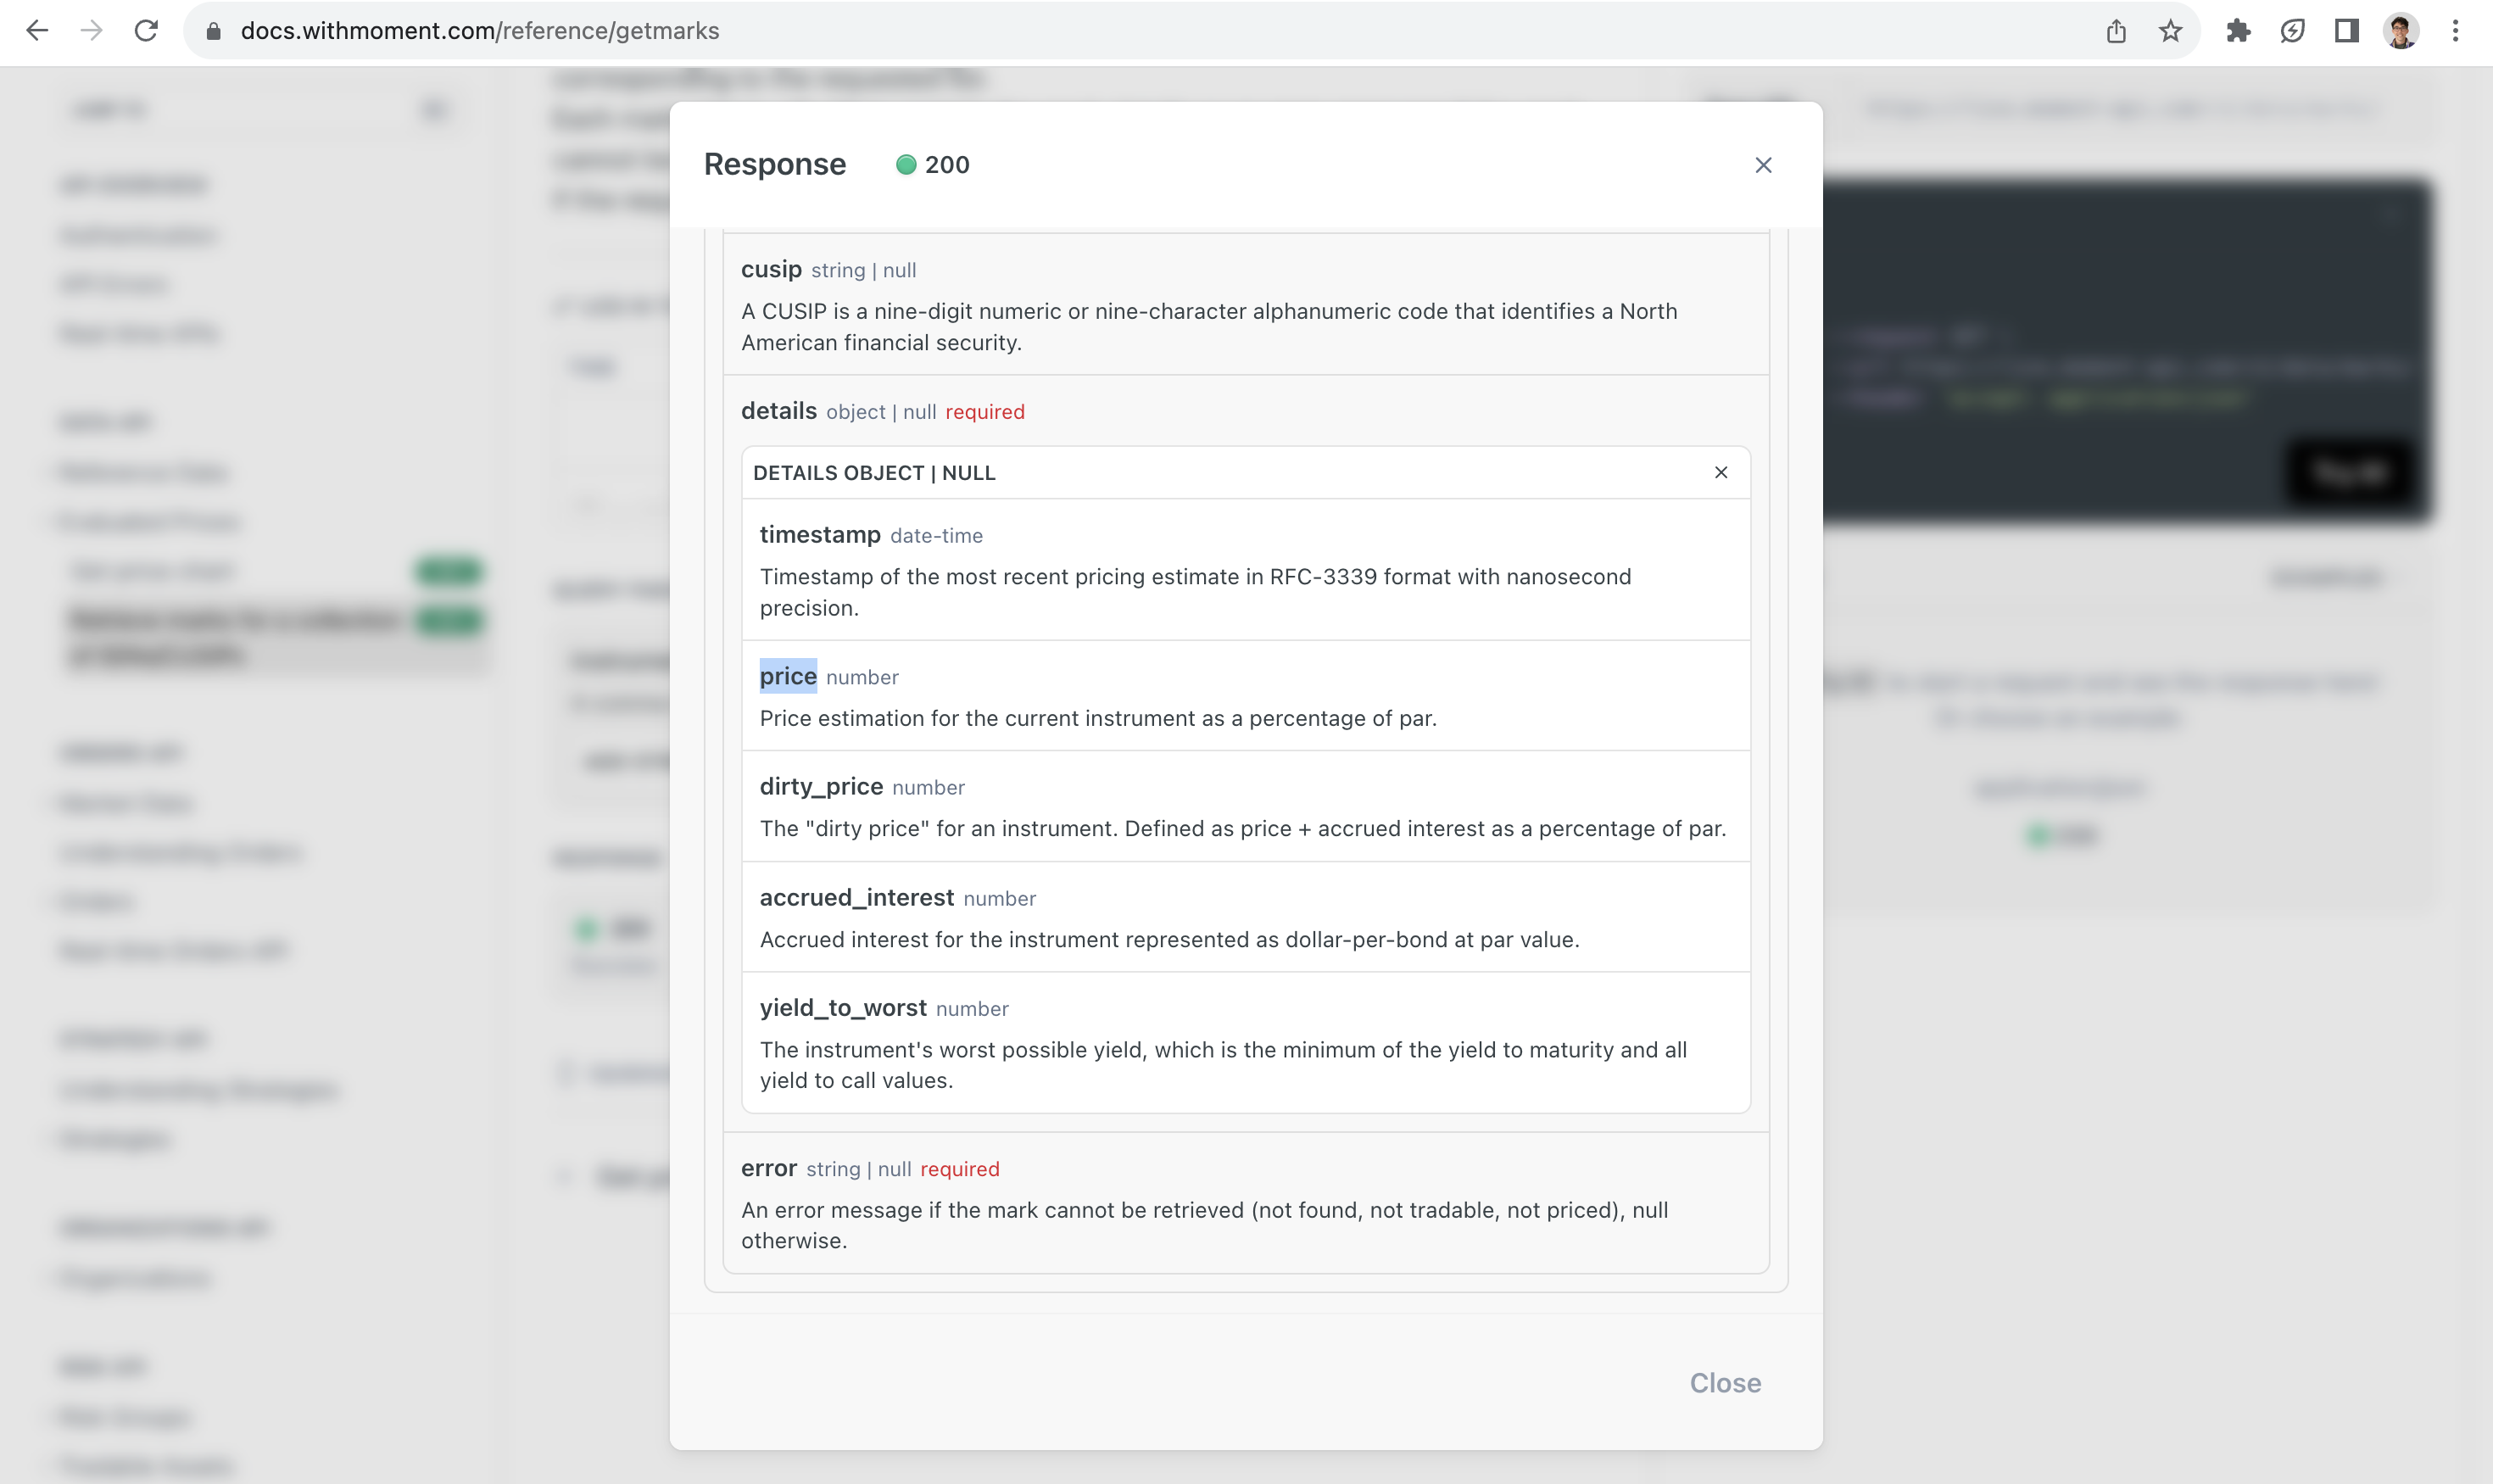
The marks endpoint can be used to retrieve the most recently observed price for each ISIN in a collection of ISINs (up to 100 maximum). It is intended to be used to mark a portfolio's current value.
The response will contain a list of mark objects, ordered by ISIN ascending, corresponding to the requested list.
Each mark object will either contain the mark details or an error message if the mark cannot be retrieved (not found, not tradable, not priced).
If the request is malformed, the endpoint will fail and return an error message.
How Bond Pricing Works
In the world of bonds, understanding par value, percentage of par value pricing, and accrued interest is crucial. Let's dive into each of these concepts:
Par Value
Par value, also known as face value or nominal value, is the amount that the issuer of the bond promises to pay back to the bondholder upon maturity. It's a critical component because it determines the bond's maturity value and the interest payments. For instance, a bond with a par value of $1,000 and an annual coupon rate of 5% will pay $50 in interest per year ($1,000 x 5%). When the bond matures, the issuer will pay the holder of the bond $1,000. It’s important to remember that, no matter what price you buy a bond for, you will receive the par value when it matures; for example, if you pay $500 to buy a bond with a par value of $1,000, you will still receive $1,000 when the bond matures.
Most bonds have a par value of $1,000, including nearly all treasury and corporate bonds. However, many US municipal bonds have a par value of $5,000. You can retrieve the par value of a bond through Moment’s reference data endpoints with the “par_value” field.

Clean Prices
When bonds are traded, their market price is often quoted as a percentage of their par value — this is called percentage of par pricing, and it’s what most market participants mean when they refer to a bond’s “price”. For example, if a bond with a $1,000 par value is trading at a price of 95, this means it's trading at 95% of its par value, or $950. Conversely, if it's trading at 105, it's trading at $1,050. Quoting bonds using the percentage of their par value makes it easy to compare bonds with different par values. Bonds that are trading at a price above $100 are said to be trading at a “premium” to par, and bonds that are trading at a price below $100 are said to be trading at a “discount” to par. By default, bonds are quoted using “clean prices”, meaning prices that do not include accrued interest. This will be discussed in more detail later.
In Moment’s Data and Orders APIs, the “price” field refers to the clean, percentage of par price. This price shows up in the Get Marks Endpoint (shown below), Get Price Chart Endpoint, Get Top of Order Book Endpoint, as well as nearly all the trading-related endpoints and messages. All orders are submitted with a clean price.
Accrued Interest
Accrued interest is the interest that has accumulated on a bond since the last interest payment but has not yet been paid to the bondholder. It's important because bonds can be bought and sold between interest payment dates, but only the holder of the bond at the time of a coupon payment is entitled to the proceeds of that payment. When a bond is sold, the seller must receive the interest that has accrued up to the sale date. The buyer, therefore, must pay the seller the bond's price plus the accrued interest, which the buyer will recoup when the next interest payment is received. Accrued interest is calculated based on the number of days that have elapsed since the last payment. It’s important to understand that the accrued interest is not incorporated into the clean price. Rather, the accrued interest is an additional amount that the buyer must pay the seller when purchasing a bond. The accrued interest remains constant throughout the day and is provided on a per-bond basis.
Example: Calculating Accrued Interest
Let’s walk through an example of calculating accrued interest. Note: This example is purely for illustrative purposes — Moment provides accrued interest values to its customers through the Reference Data API, meaning that Moment’s customers never have to calculate accrued interest themselves.
Suppose you're looking at a bond with the following characteristics:
- Par Value: $1,000
- Coupon Rate: 6% annually
- Coupon Payment Frequency: Semi-annually (every 6 months)
- Last Coupon Payment Date: January 1
- Next Coupon Payment Date: July 1
- Date of Purchase: April 1
Now, let's calculate the accrued interest if you were to buy this bond on April 1.
Calculation
- Find the Annual Coupon Payment:
Annual Coupon Payment = Par Value × Coupon Rate = $1,000 x 6% = $60 - Determine the Coupon Payment per Period:
Since the bond pays semi-annually, the payment per period is half of the annual coupon payment.
Payment per Period = Annual Coupon Payment / 2 = $60 / 2 =$30 - Calculate the Number of Days of Accrued Interest:
From January 1 to April 1 is 90 days (assuming no leap year). Note that this is a simplification of a concept called a “day count convention”. - Determine the Total Days in the Payment Period:
There are 180 days in the semi-annual period (January 1 to July 1). Note that this is a simplification of a concept called a “day count convention”. - Calculate the Accrued Interest:
Accrued Interest = Payment per Period × (Number of Days of Accrued Interest / Total Days in the Payment Period)
Accrued Interest = $30 × (90180) = $30 × 0.5 = $15
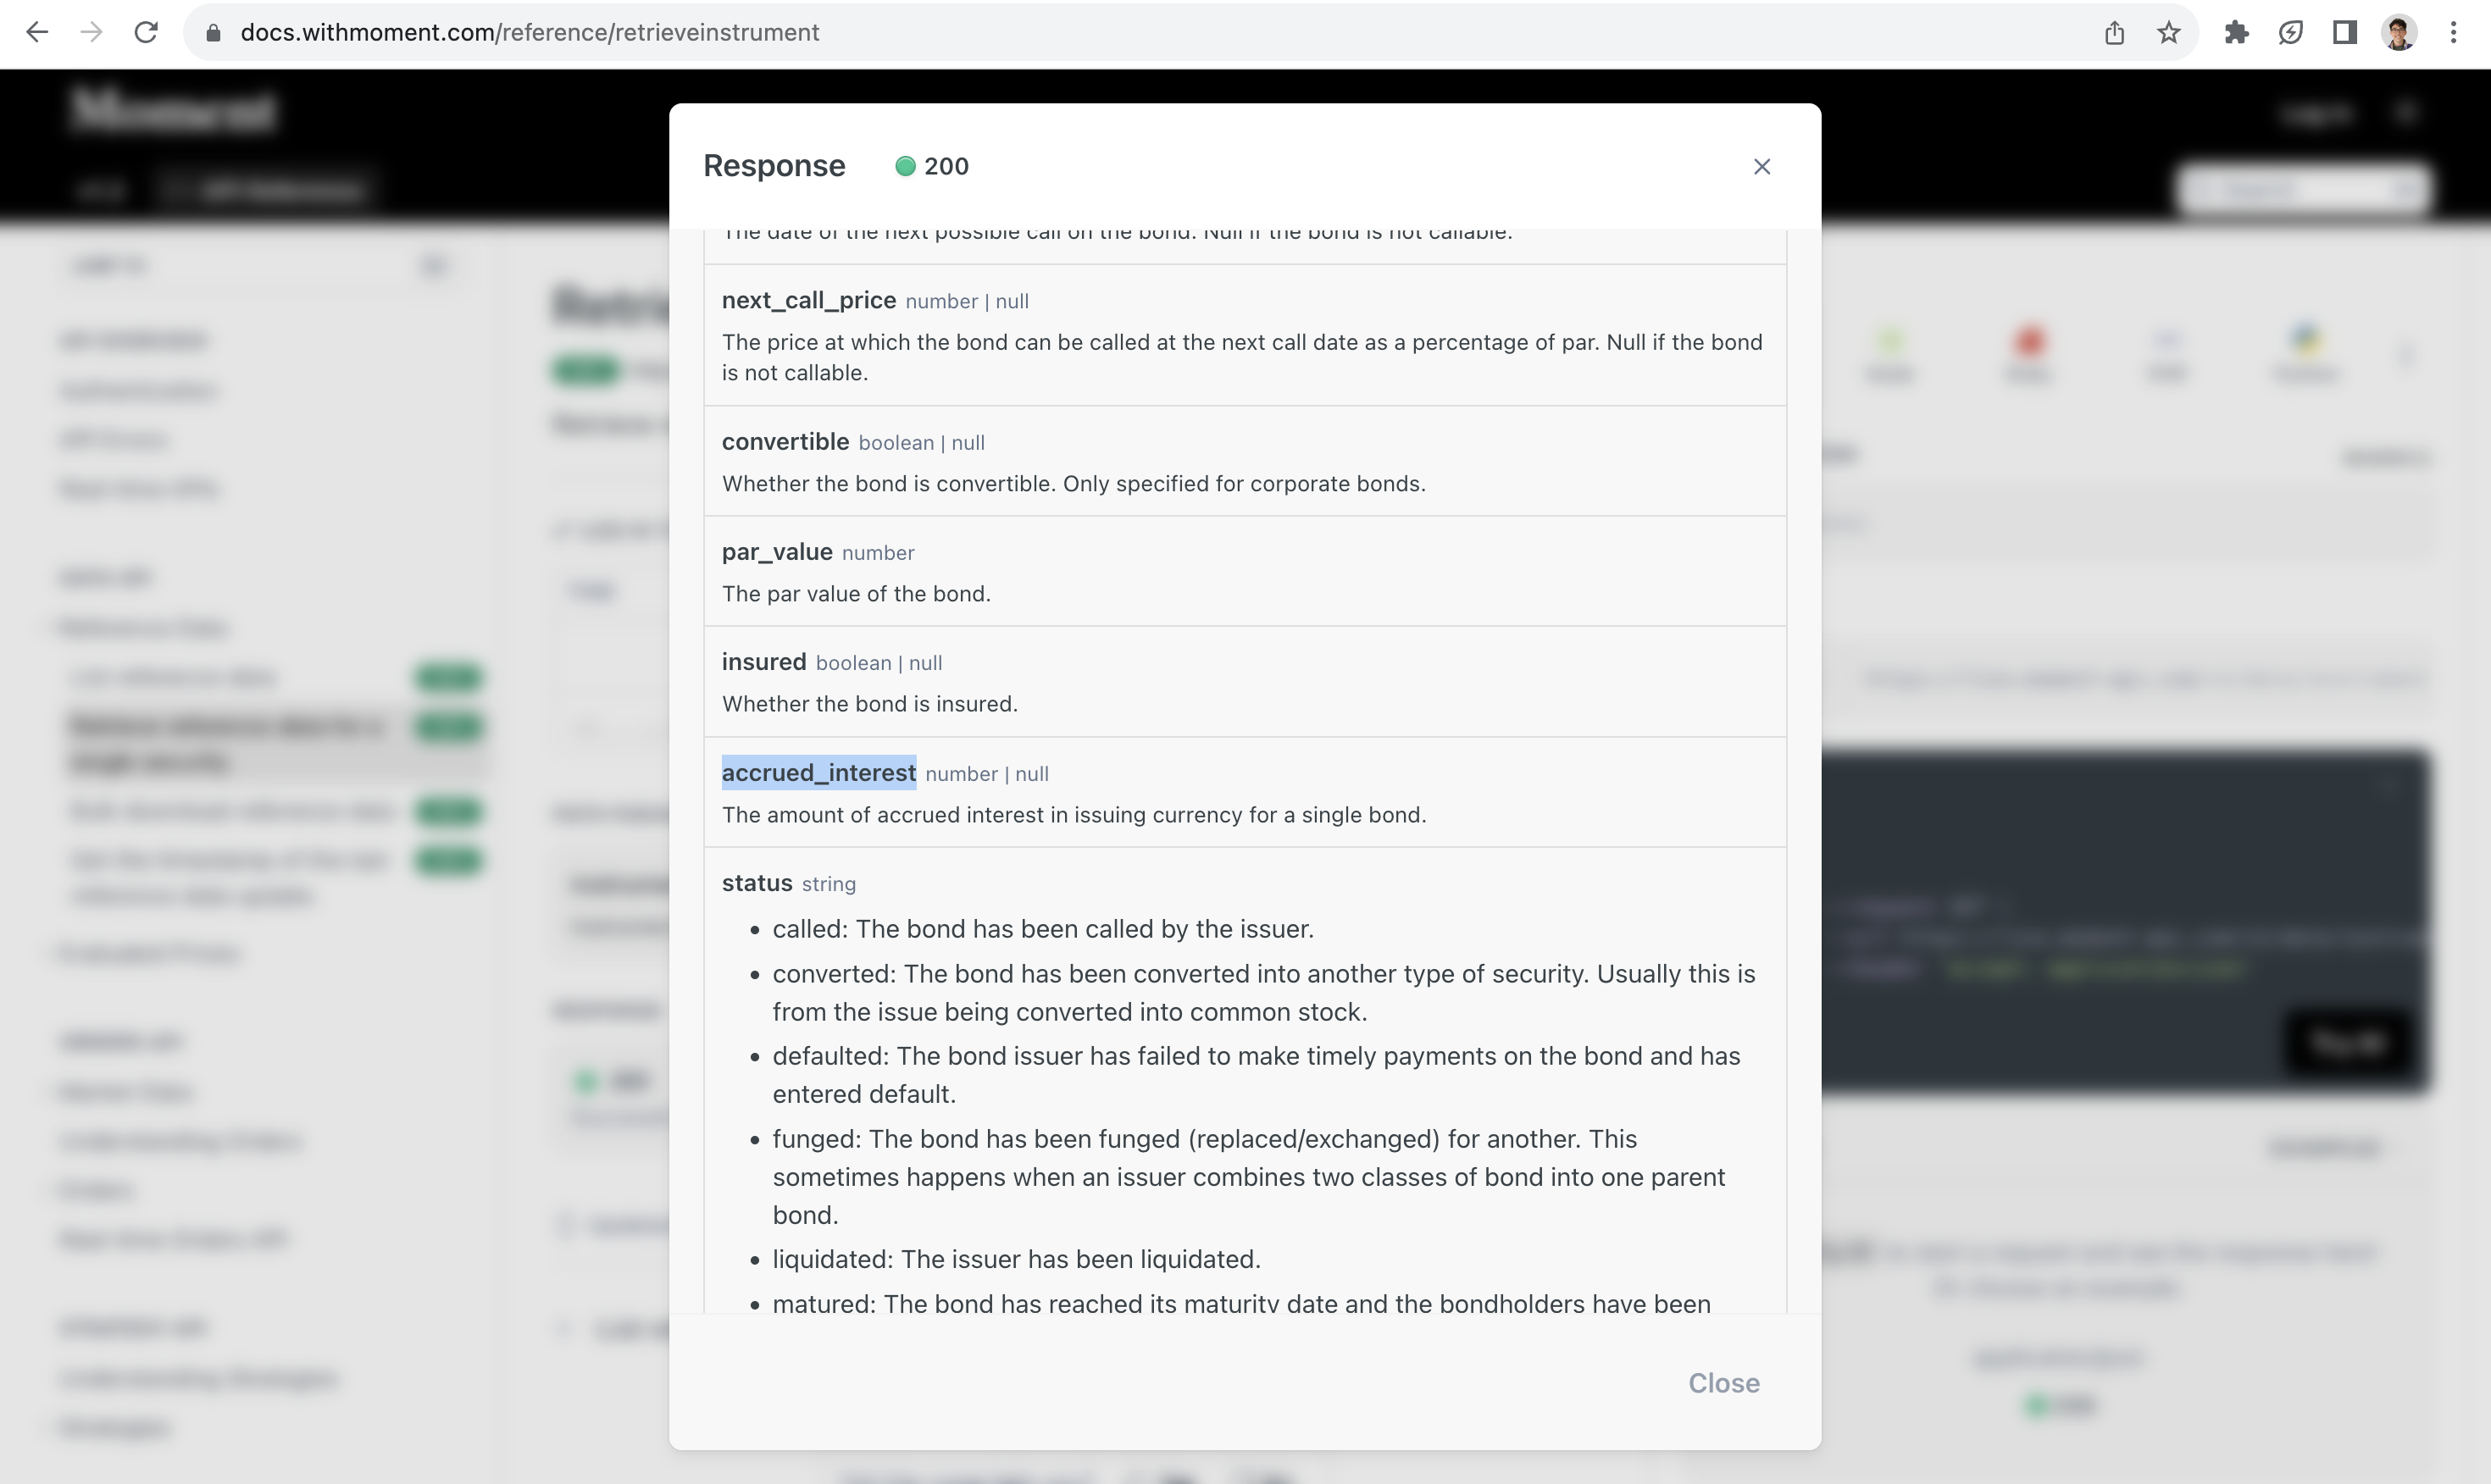
Moment provides the accrued interest in every reference data endpoint, such as the Retrieve Reference Data Endpoint shown below. API users should pull accrued interest values daily and show them to users as part of the trade execution workflow. As discussed later in this document, the accrued interest should be used to calculate the total dollar amount of a trade.
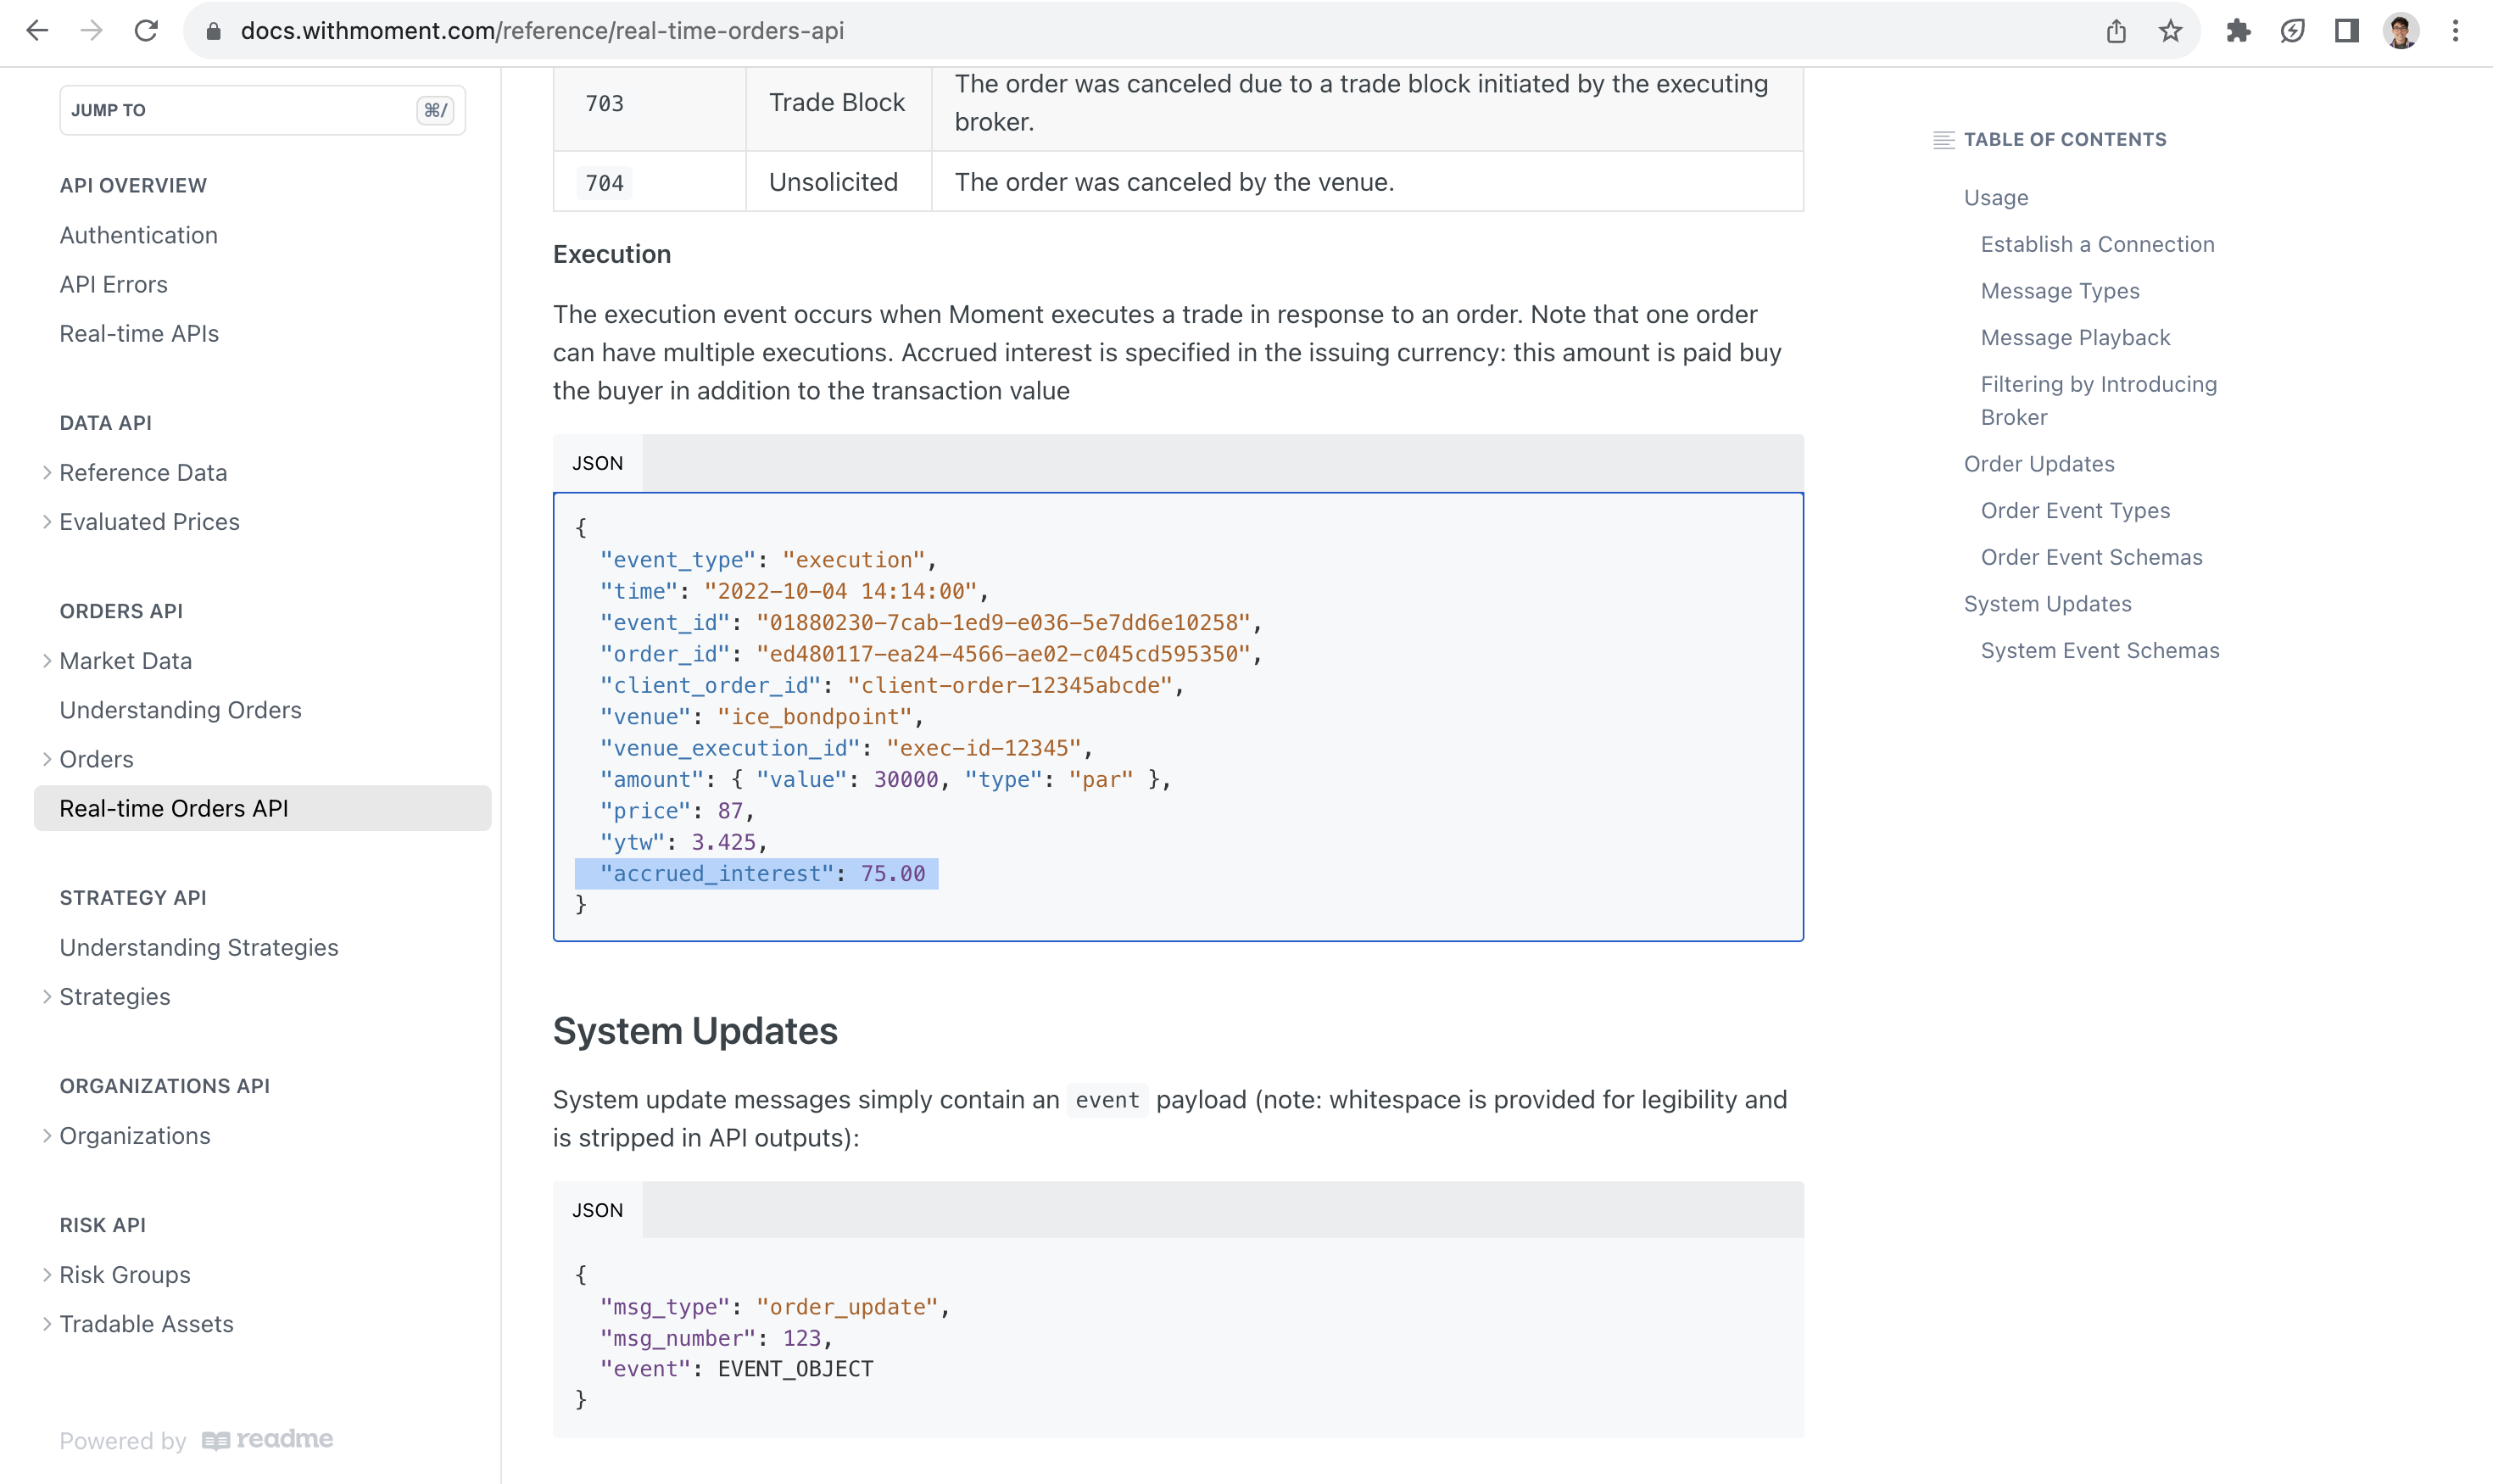
Moment also provides the accrued interest for every execution that occurs through Moment’s platform. This allows API users to calculate the total dollar amount of every executed trade.
Calculating the total dollar amount of a trade
To calculate the total size of a bond trade, you must know the following pieces of information:
- Number of Bonds: This is the number of individual bonds being traded (e.g. 2 bonds).
- Par Value: The face value of each bond (e.g. $1,000).
- Price: The clean price of the bond, expressed as a percentage of the par value (e.g. $90).
- Accrued Interest: The interest that has accumulated on each bond since the last coupon payment (e.g. $15 per bond). The accrued interest is defined per bond.
Given these pieces of information, the trade size is straightforward to calculate:
Trade Size = (# of Bonds) x (Par Value) x (Price) / 100 + (# of Bonds) x (Accrued Interest)
Example: Calculating Total Trade Size
Suppose you're dealing with the following bond trade details:
- Number of Bonds: 2
- Par Value per Bond: $1,000
- Price: $90
- Accrued Interest: $15
The total trade size would be:
Trade Size = 2 x 1000 x 90/100 + 2 x 15 = $1830
Moment currently provides all the data that customers need to calculate total trade sizes. In the future, Moment will also provide a Calculate Trade Size Endpoint that allows API users to calculate a trade size based simply on an CUSIP / ISIN, price, and number of bonds.
Dirty Prices: a shortcut for trade size calculations
In the bond market, the term “price” refers to the clean price discussed above. The clean price is quoted as a percentage of par and does not include accrued interest. To make it easier to calculate total trade sizes, Moment also provides “dirty prices”, which do include accrued interest. Calculating the total trade size with a dirty price is even easier than with a clean price:
Trade Size = (# of Bonds) x (Par Value) x (Dirty Price) / 100
In other words, the dirty price allows you to ignore the concept of accrued interest when calculating a total trade size.
Moment currently provides dirty prices in addition to clean prices in the Get Marks Endpoint using the field name “dirty_price”. As mentioned above, the field name “price” refers to the clean price.
Evaluated Corporate Bond Pricing Methodology
Moment’s Pricing Methodology
Moment follows a waterfall approach for corporate bond pricing, relying on direct observations (e.g. TRACE trades, dealer quotes) for sufficiently liquid bonds and falling back to a factor-based model for highly illiquid bonds without direct observations. This is done through direct observation modeling:
Direct Observation Modeling
Moment receives TRACE data on ~10,000 unique corporate bonds and dealer quote data on another ~40,000 daily, covering nearly the entire universe of corporate bonds. Thus, Moment can price most bonds using several direct observation-based models, each following the same high-level procedure for evaluating a bond’s fair value:
- Adjust historical trade and quote spreads to the present. Since most bonds are traded and quoted infrequently, there can be significant displacements in interest rates and credit markets between times of observation and evaluation. Moment uses a proprietary factor model to “beta-adjust” historical observations to the present.
- Estimate the distribution of each observation around the theoretical fair value. After adjusting observations to the present, Moment estimates mean and variance of the distribution of the observation around the theoretical fair value. The estimated mean and variance are functions of factors including observation staleness and type (trade vs quote) and counterparties (dealer-to-dealer vs dealer-to-customer trade)
- Fit a robust likelihood model to the data to determine a spread. Once each observation has an estimated distribution around the theoretical fair value, estimating a fair value spread becomes a maximum likelihood problem. Since Moment uses fat-tailed distributions to model observations, Moment’s fair value model natively handles outlier rejection.
Updated over 1 year ago